034 — QC + window audit (visualization)#
Visual audit of QC flags + calibration window selection results across the full dataset. Used for periodic sanity checks before XPalm calibration runs.
Runs on the bundled synthetic sample.
import pandas as pd
import matplotlib.pyplot as plt

from palmwtc.config import DataPaths
from palmwtc.viz import set_style

set_style()
paths = DataPaths.resolve()
print(paths.describe())
DataPaths (source=sample (bundled synthetic), site=libz):
  raw_dir       = /home/runner/work/palmwtc/palmwtc/src/palmwtc/data/sample/synthetic
  processed_dir = /home/runner/work/palmwtc/palmwtc/src/palmwtc/data/sample/Data/Integrated_QC_Data
  exports_dir   = /home/runner/work/palmwtc/palmwtc/src/palmwtc/data/sample/exports
  config_dir    = /home/runner/work/palmwtc/palmwtc/src/palmwtc/data/sample/config
  extras        = <none>
# Read QC flag summary from the synthetic parquet.
qc_path = paths.raw_dir / "QC_Flagged_Data_synthetic.parquet"
df = pd.read_parquet(qc_path, columns=["TIMESTAMP", "CO2_C1_qc_flag", "CO2_C2_qc_flag", "H2O_C1_qc_flag", "H2O_C2_qc_flag"])
counts = df[["CO2_C1_qc_flag", "CO2_C2_qc_flag", "H2O_C1_qc_flag", "H2O_C2_qc_flag"]].sum()
print("QC flag totals (1 = fail):")
print(counts.to_string())
QC flag totals (1 = fail):
CO2_C1_qc_flag    94
CO2_C2_qc_flag     0
H2O_C1_qc_flag     1
H2O_C2_qc_flag     2
fig, ax = plt.subplots(figsize=(8, 3))
counts.plot(kind="barh", ax=ax, color="#a23b72")
ax.set_xlabel("Flagged rows")
ax.set_title("QC flag counts per variable (synthetic sample, 1 week)")
plt.tight_layout()
plt.show()
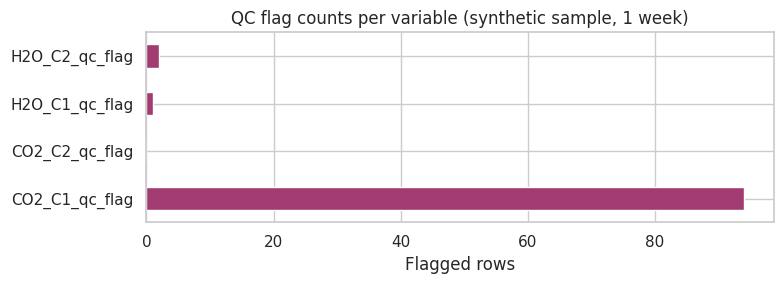
Real LIBZ data typically shows < 5% flagged rows per variable. Sudden
spikes in any column point at a specific instrument event — chase via
docs/measurement_log/<sensor>.md to attribute.